
Are you aware that you can learn about market behaviour by recognising the Elliot Wave Pattern? Definitely! That’s true for sure! However, we should first understand the Elliot Wave principle before we start driving into patterns:
Traders can use the Elliot wave principle to analyse the financial market cycle using technical analysis. Trading strategies based on the Elliot wave theory allow trades to predict market trends by identifying extremes in prices and investors’ behaviour. According to the Elliot wave Theory, market movements are governed by the psychology of crowds.
Elliot Wave Patterns reflect the current market sentiment, alternating between bearish and bullish periods. A theory such as Elliot Waves should not be viewed as a technical indicator but rather as a means of predicting market behaviour. You will find five of the main types of this pattern in this article to help traders forecast market movement. Read on to see the other details about Elliot Wave Pattern.
What is Elliot Wave Theory?
The Elliot Wave Theory is named in honour of Ralph Nelson Elliot (28 July 1871 – 15 January 1948). He was a famous American author and accountant. He based his prediction on his study of nature and the Dow Theory that repetitive waves throughout the stock market.
His analysis of market trend patterns allowed him to identify the specific characteristics of wave patterns and predict the market based on them in greater detail. A part of Elliot’s work was influenced by Dow theory, which defines price movement as waves, but he realised the market’s fractal nature. In 1938, Elliot published a book titled “The Wave Principle,” He wrote about his theory of market patterns.
Historical background
Elliot Wave Theory became widely known with the advent of the stock market in the 1930s. Elliot released a treatise on his theory called “The Wave Principle” in August 1938 after he identified a bear market reversal point for the Dow Jones Industrial Average.
After a long period of decline, Elliot Wave Theory saw a resurgence among financial professionals. Technical analysts A.J Frost and Robert Prechter presented the Elliot Wave Principle to the general public in their book “Elliot Wave Principle” Key to Market Behavior” in the late 1970s.”
In the process, Frost and Prechter have been credited with predicting the 1980s bull market in U.S. equities and the ensuing crash of Black Monday.
Breaking down the Elliot theory
Based on Elliot Wave Theory, price fluctuations are characterised by patterns called “waves.” So, in a way, there are numerous price points, including periods of highs and lows.
The theory suggests that each wave is a fractal. Moreover, each fractal exhibits characteristics of a collective whole, which encompasses all the features of a natural phenomenon. Among the example are lightning, ferns, peacock feathers, and shorelines.
The Elliot Wave Theory is based on probabilistic methodology, which means that future events have a specific chance of occurring. To attain this objective, it attempts to identify two aspects of market behaviour from the study of wave patterns:
Trend Exhaustion: The moment when a market is most likely to reverse course.
Trend Extension: The point where a trend reverts to its initial direction.
According to Elliot Wave Theory, corrective and impulsive waves appear in nine distinct ” degrees ” patterns. Each degree corresponds to a frame of reference ” degrees ” patterns ascending from large to small.
- Grand Supercycle
- Supercycle
- Cycle
- Primary
- Intermediate
- Minor
- Minute
- Minuette
- Subminuette
The behaviour of impulsive and corrective waves exhibits the same fractal characteristics. Apart from the Grand Supercycle, each pattern consists of smaller patterns within a broader way.
You must identify the correct degree and ave count based on the current price action to apply Elliot Wave successfully. The outcome of this process is the quantification and prediction of market trends and corrections and the future direction of the market.
The basics of Elliot Wave Pattern
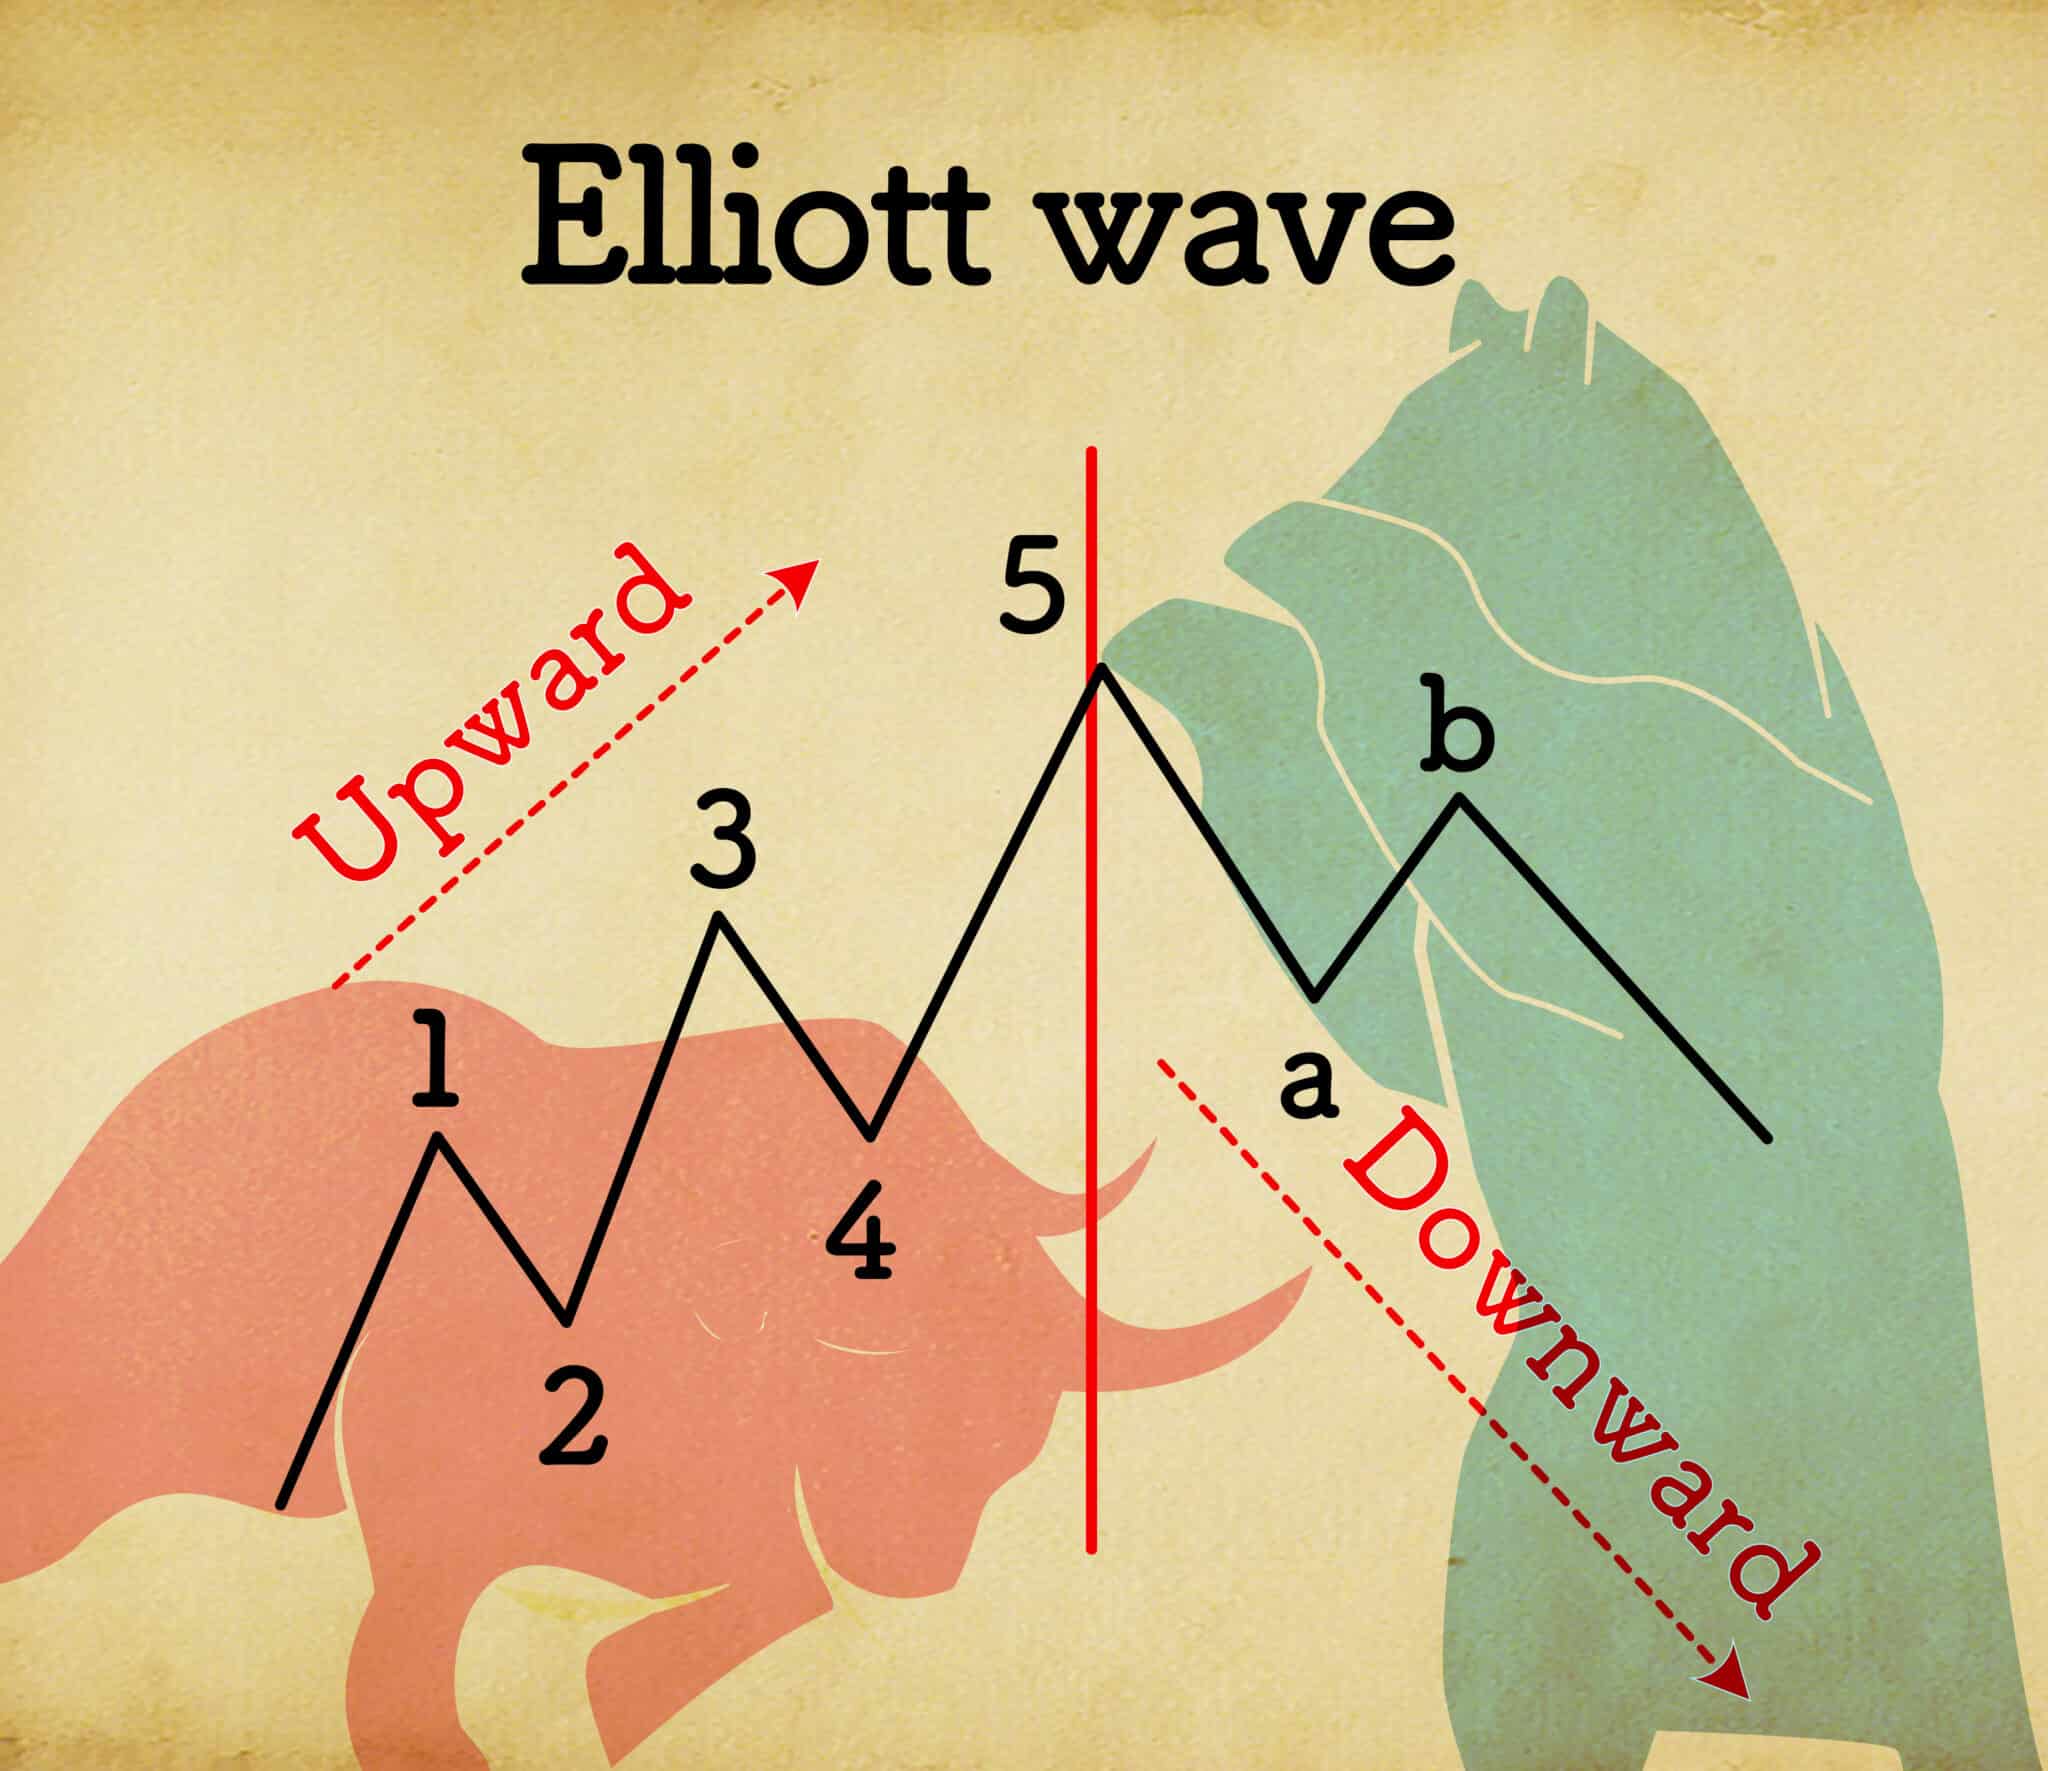
The Elliot Wave Theory is based on the idea that Elliot Waves are five sub-waves – three up and two down. The trend reverses during the 5th wave and becomes corrective in three significant waves. Markets don’t move linearly, so five-wave moves are necessary to accommodate that they can move differently.
Waves are divided into two main types according to Elliott Wave Theory:
- The mechanical waves (waves 1,3, and 5; A and C) are uniform and definite.
- The corrective waves (waves 2 and 4; B) can be inconsistent and confusing.
Motive Waves
Each of the Motive waves (1, 3, and 5) follow the prevailing trend, while the declining Corrective waves (2 & 4) oppose it. You can see this pattern play out if you watch it all the way through, as it confirms we’re moving along in a trend in the right direction.
For Elliott Waves (EWs) to be confirmed, they must meet three important conditions (Source):
No wave two retraces more than 100% of wave 1. Wave one usually retraced 50% to 61.8% of wave 1.
In wave 4, the retracement rate is usually between 38.2% and 50% of wave 3 – never exceeding 100%.
There’s always a wave three coming after wave 1; it’s never the shortest wave; it typically extends 161.8 x wave 1.
By ensuring a trend progresses, one gets a more detailed version of Dow Theory that the market goes through several large swings. It would help if you also kept in mind the following:
Waves 1 and 5 usually have the same price and time duration;
Corrective wave A tends to be similar in length to wave C.
There must be symmetry in both the time and cost of the waves;
Following the law of alternation, wave two must be a simple Elliott Wave pattern, whereas wave four must be a complex Elliott Wave pattern.
Corrective Waves:
These waves counteract the trend and are called corrective waves.
Corrective waves are more complex and lengthy than waves that are motive. Each correction pattern consists of three waves called A, B, and C.
Corrective waves are divided into zigzag, diagonal, and triangle waves.
Spotting trend changes
The direction of a trend is also determined by the strength of impulsive and corrective waves. Stocks in uptrends and then move down more than the last impulse up are likely to indicate an end to the trend. When the corrective waves begin to resemble impulse waves, that means the trend may have changed. The most significant movement always occurs in the direction of the trend.
Types of Elliot Wave Pattern
The following are the five significant types of Elliott Wave Patterns:
1. Impulse:
impulses are the most common motive wave in a market and can be easily detected.
A motive wave is composed of five parts: three motive waves and two correctives, forming a 5-3-5-3-5 structure.
There are, however, specific rules that govern the formation of the wave.
The impulse wave will not form if any of these rules are not followed; therefore, it needs to be re-labelled as an impulse wave.
Impulse waves are formed by following three rules:
In Wave 2, the retracement cannot exceed 100% of Wave 1.
Wave 3 can’t be the shortest of waves 1, 3, or 5.
Wave 1 and Wave 4 cannot overlap.
Impulse waves are the best at moving the market and are the most common motive waves.
2. Diagonal:
There is also a diagonal motive wave composed of five sub-waves that move opposite the trend.
Diagonal lines look like wedges that might be expanding or contracting. Depending on the diagonal type observed, a diagonal can have subways that do not have the exact count.
Like other motive waves, the diagonal wave has sub-waves that do not fully retrace previous sub-waves. Furthermore, sub-wave 3 of the diagonal isn’t the shortest wave.
A diagonal can be classified into an ending diagonal and a leading diagonal.
A diagonal ending usually occurs during the fifth wave of an impulse wave or the last wave of a correction wave. Similarly, you can find the leading options in the wave A position of a zigzag correction or the Wave 1 of an impulse wave.
3. Zigzag:
There are three waves in Zig-Zag that move strongly up or down and are labelled A, B, and C.
Traditionally, the A and C waves are motive waves, and the B wave is corrective (often with three sub-waves).
A zigzag pattern is a sharp decline in a bull run or a rapid advance in a bear run that substantially corrects the previous Impulse pattern price level.
Another way to form zigzags is to show them in a combination, called the double or triple zigzag, which connects two or three zigzags with another corrective wave between them.
4. Flat:
Among the three-wave corrections, the flat consists of a 3-3-5 structure called the A-B-C structure.
The flat structure consists of two corrective waves and Wave C motive waves with five sub-waves.
The flat is a pattern in which movement is sideways. For example, it is common for the fourth wave of an impulse wave to be flat, while the second wave rarely is.
Generally speaking, flats don’t appear clear on technical charts because they have a variety of variations.
Depending on the flat, wave B may extend beyond the start of the A wave, and the C wave may extend beyond the beginning of the B wave. The expanded flat may have these characteristics.
5. Triangle:
It consists of five sub-waves, numbered A-B-C-D-E, that form a structure of 3-3-3-3-3.
In this corrective pattern, forces are balanced, and movement is sideways.
Depending on whether the triangle is expanding, in which case each sub-wave gets more extensive, or contract, in which case it looks like a wedge.
Depending on whether the triangles are pointed sideways, upward, or downward, they can also be categorised as symmetrical, descending, or ascending.
In complex combinations, the sub-waves may form. While it may be simple to spot a triangle theoretically, identifying them in the real world may take some practice.
Time frame to use
It is theoretically possible to apply Elliott wave patterns to any time frame because they are fractal. Therefore, choosing the timeframe you are most comfortable using is most important. For example, in the case of day traders, you may use one-minute, five-minute, or one-hour candles. On the other hand, you might use four-hour, daily, or weekly candles when swing trading. If you are unsure of your strengths, try several time frames in a demo account to determine which one suits you best.
Is Elliot wave pattern effective?
Using Elliott Wave Theory, you can make highly accurate predictions about future stock price movements based on past stock data. However, you should make sure you combine it with other technical indicators.
Limitations
The problem with this chart pattern and every other way are that you will never know for sure where a design will start and end until it has already occurred.
Using technical analysis, indicators, and broad market clues can help you guess when a wave is about to break, but you will only find out if you’re right when you miss the best entry point for a trade. You can start counting waves based on historical charts at a trend reversal – i.e. when an uptrend ends, and a downtrend begins or vice versa.
Waves that violate a rule, for instance, a wave three failing to break the high of wave one, mean your initial assessment was incorrect, which means “recounting.”
Bottom line
Although initially developed for stocks, Elliott Wave Theory has gained popularity among investors in cryptocurrencies, futures, and forex. Pricing charts can be analysed using many Elliott Wave guidelines and methods. These charts can be used independently or combined with other technical tools such as momentum oscillators or Fibonacci retracements. In general, an individual’s ability “Elliotttician” to predict usually depends on their skill.
The Elliott Wave Theory serves an essential function in quantifying current market sentiment. By looking at the degree of wave patterns, it becomes apparent that investors cycle from cynicism to euphoria and vice versa repeatedly. By understanding these mass psychology tendencies, one may formulate timely trading decisions.