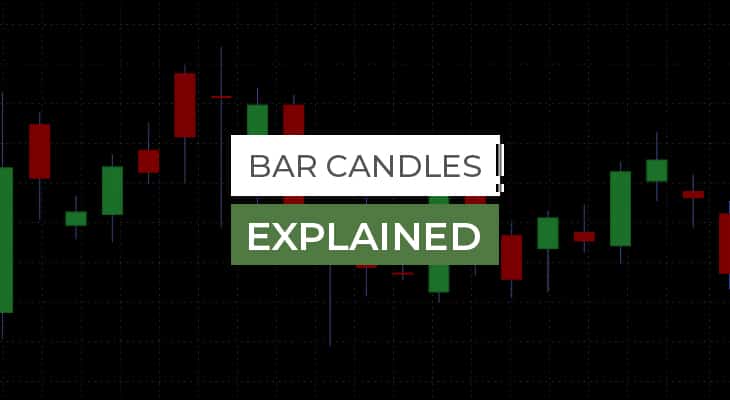
Bar Candles Explained

In this article
We are sure you probably have heard about the forex candlestick patterns. But, along with the candlestick patterns, there are bar candles that some traders use in their trading.
In this guide, we’ll dig deeper into what bar candles are and how you can use them in your trading strategies.
What are bar candles?
A bar candle is a charting style that depicts price action over a specific period. Each bar represents the opening, high, low, and closing prices for the chosen period. This is also known as OHLC pricing.
Unlike conventional candlesticks, which a Japanese rice trader brought, bar candles are a Western creation. Before the introduction of candlestick charts, they were the primary charting style preferred by American and European traders.
A vertical line and two horizontal lines are displayed for each bar in a bar chart. The vertical line’s top limit represents the bar’s peak price.
The lower threshold of the vertical line represents the bar’s low pricing. The opening price is represented by the horizontal line on the left side of the vertical line. The horizontal line shows the closing price to the right of the vertical line.
If the closing price is higher than the open price, the bar will be tinted black or green.
If the close is lower than the open, the price fell during that period, and the chart may be coloured red.
The use of colour coding on the bars allows traders to see trends and price changes more easily. Most charting software offers colour coding as an option.
How to read a bar candle?
A bar chart provides a wealth of information to traders and investors because it displays the open, high, low, and closing prices for each session.
Long vertical bars indicate that there was a significant price difference between the period’s peak and low. This suggests that volatility increased throughout that time. Conversely, when a bar has relatively small vertical bars, it indicates that volatility was low.
If there is a huge gap between the open and close, it indicates that the price has moved significantly. If the close is significantly higher than the open, it indicates that buyers were quite active over the period, which may imply that more buying will occur in the future.
If the close is fairly close to the open, there was not much conviction in the price movement during the period.
The close’s position in relation to the high and low may also provide useful information. For example, if a currency pair climbed higher during the period but closed significantly below the high, it indicates that sellers came in near the session’s conclusion. This is less bullish than if the asset closed near its period high.
The colours on a bar chart can convey information at a glance if they are colour coded based on whether the price grows or lowers during the period.
A general upward tendency is usually illustrated by more green/black bars. Downtrends, on the other hand, are represented by red bars.
Bar candle patterns
Most bar patterns are made up of two to three distinct bars that come together to form a certain structure. Bar patterns are divided into two types: continuation patterns and reversal patterns.
As the name implies, a continuation pattern is likely to advance prices in the direction of the current trend when the pattern is completed. On the other hand, a reversal pattern is likely to retrace or reverse the direction of the present price trend.
The two most important bar patterns include the inside bar pattern and the outside bar pattern.
Let’s discuss each one of them.
1. Inside bar pattern
Depending on which side of the pattern a breakout occurs, an inside bar pattern might be a continuation or reversal pattern.
The inside bar pattern is a two-bar configuration that depicts a market environment in which traders are indecisive and hesitant. This is because the first bar in the pattern, which can be either bullish or bearish, is of relatively regular size, and the second bar, the inside bar, is entirely enveloped by the first bar.
2. Outside bar pattern
In candlestick analysis, outside bar formations are frequently referred to as engulfing patterns. Outside bar formations are reversal patterns that often emerge at the end of a long market run.
A bullish outside bar pattern is more likely to occur after a downturn, whereas a bearish outside bar formation is more likely to occur after an uptrend.
The overall psychology behind the bullish outer bar pattern is that the present downtrend is starting to fade, and attitude is shifting from bearish to bullish.
Similarly, within the negative outside bar formation, the upswing is fading, and the sentiment is shifting from bullish to bearish.
Although bar patterns can be used on any period, they are significantly more reliable on longer timeframes such as four hours and above.
They function best on the daily chart because the daily price bar is so important in the market. Furthermore, the more active a market is in terms of volume, the more trustworthy the bar pattern will be.
As a result, the optimal application of bar patterns for market analysis happens when they are applied to daily or weekly charts and on a highly traded market instrument. Currency pairs such as EUR/USD and GBP/USD are examples of highly liquid markets.
Bars vs candlesticks
Japanese candlestick charts are extremely similar to bar charts. However, the two chart types display the same data in different ways.
A bar chart comprises a vertical line with small horizontal lines on the left and right indicating the open and close.
Candlesticks, like bars, contain a vertical line that shows the high and low of the period (called a shadow or wick), but a thicker part represents the difference between open and close, called a real body.
If the close is below the open, the body is shaded or coloured red. Conversely, if the close is above the open, the body is shaded or coloured white or green.
Bottom line
So, there you have it. Although the bar candles are not popular among many forex traders, you can use them in your technical analysis.
Jason Morgan is an experienced forex analyst and writer with a deep understanding of the financial markets. With over 13+ years of industry experience, he has honed his skills in analyzing and forecasting currency movements, providing valuable insights to traders and investors.
Forex Content Writer | Market Analyst
Relevant Posts
4 Tips for Choosing a Forex Broker
If you are a trader in the Forex or foreign exchange market, then there is…
Read more

Japanese Candlesticks Explained
[top_three_brokers] The traders use the Japanese Candlesticks to construct charts and analyse the price movement…
Read more

Day Trading and Swing Trading the Currency Market
[top_three_brokers] When it comes to currency trading, the timing of trades can have a huge…
Read more

Line Graph Explained
[top_three_brokers] In forex trading, there are different types of charts that help you visualise price…
Read more

Forex Trading in Tanzania
[top_three_brokers] If you've looked into trading forex as Tanzanian and feel there can be an…
Read more

What is Hedging in Forex?
[top_three_brokers] Hedging in forex is a common feature for many trading accounts provided by brokers.…
Read more

What is a Pip in Forex and How Much are They Worth?
[top_three_brokers] Learn what is a pip in forex A commonly asked question, what is a…
Read more

Fundamental Analysis in Forex – Explained
[top_three_brokers] Have you ever come across a situation where a random presidential tweet disrupts the…
Read more

Which are the Best Forex Indicators to Use?
[top_three_brokers] If you are new to forex trading, technical analysis can be like solving a…
Read more

Forex Signals – Does it Improve Your Trading?
[top_three_brokers] If you are new to forex trading, you might have heard of forex trading…
Read more
4 Tips for Choosing a Forex Broker
If you are a trader in the Forex or foreign exchange market, then there is…

Japanese Candlesticks Explained
[top_three_brokers] The traders use the Japanese Candlesticks to construct charts and analyse the price movement…

Day Trading and Swing Trading the Currency Market
[top_three_brokers] When it comes to currency trading, the timing of trades can have a huge…

Line Graph Explained
[top_three_brokers] In forex trading, there are different types of charts that help you visualise price…

Forex Trading in Tanzania
[top_three_brokers] If you've looked into trading forex as Tanzanian and feel there can be an…

What is Hedging in Forex?
[top_three_brokers] Hedging in forex is a common feature for many trading accounts provided by brokers.…

What is a Pip in Forex and How Much are They Worth?
[top_three_brokers] Learn what is a pip in forex A commonly asked question, what is a…

Fundamental Analysis in Forex – Explained
[top_three_brokers] Have you ever come across a situation where a random presidential tweet disrupts the…

Which are the Best Forex Indicators to Use?
[top_three_brokers] If you are new to forex trading, technical analysis can be like solving a…

Forex Signals – Does it Improve Your Trading?
[top_three_brokers] If you are new to forex trading, you might have heard of forex trading…


